
Page 55 - AUN-QA
P. 55
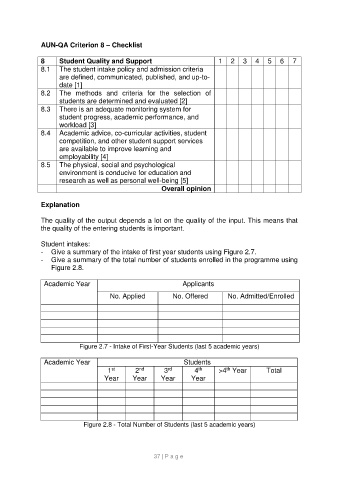
AUN-QA Criterion 8 – Checklist

               8      Student Quality and Support                             1  2  3  4  5  6          7
               8.1    The student intake policy and admission criteria
                      are defined, communicated, published, and up-to-
                      date [1]
               8.2    The  methods  and  criteria  for  the  selection  of
                      students are determined and evaluated [2]
               8.3    There is an adequate monitoring system for
                      student progress, academic performance, and
                      workload [3]
               8.4    Academic advice, co-curricular activities, student
                      competition, and other student support services
                      are available to improve learning and
                      employability [4]
               8.5    The physical, social and psychological
                      environment is conducive for education and
                      research as well as personal well-being [5]
                                                          Overall opinion

               Explanation

               The quality of the output depends a lot on the quality of the input. This means that
               the quality of the entering students is important.

               Student intakes:
               -  Give a summary of the intake of first year students using Figure 2.7.
               -  Give a summary of the total number of students enrolled in the programme using
                   Figure 2.8.

                Academic Year                                    Applicants

                                        No. Applied           No. Offered        No. Admitted/Enrolled


                             Figure 2.7 - Intake of First-Year Students (last 5 academic years)

                Academic Year                                     Students
                                        st
                                       1         2         3         4        >4  Year         Total
                                                  nd
                                                                                 th
                                                                       th
                                                            rd
                                      Year      Year      Year      Year


                              Figure 2.8 - Total Number of Students (last 5 academic years)


                                                       37 | P a g e